data visualization
We take complex data critical to your mission and craft it into easy-to-understand visual representations to help you reach your audiences.
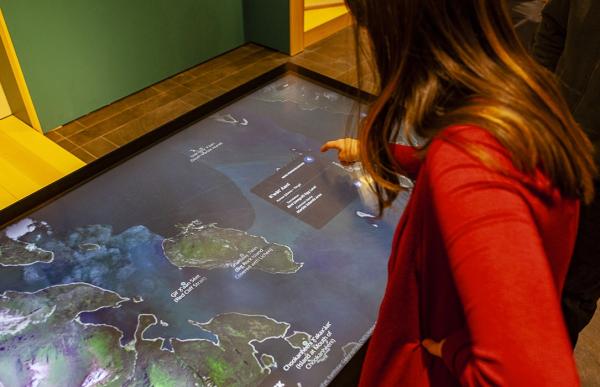
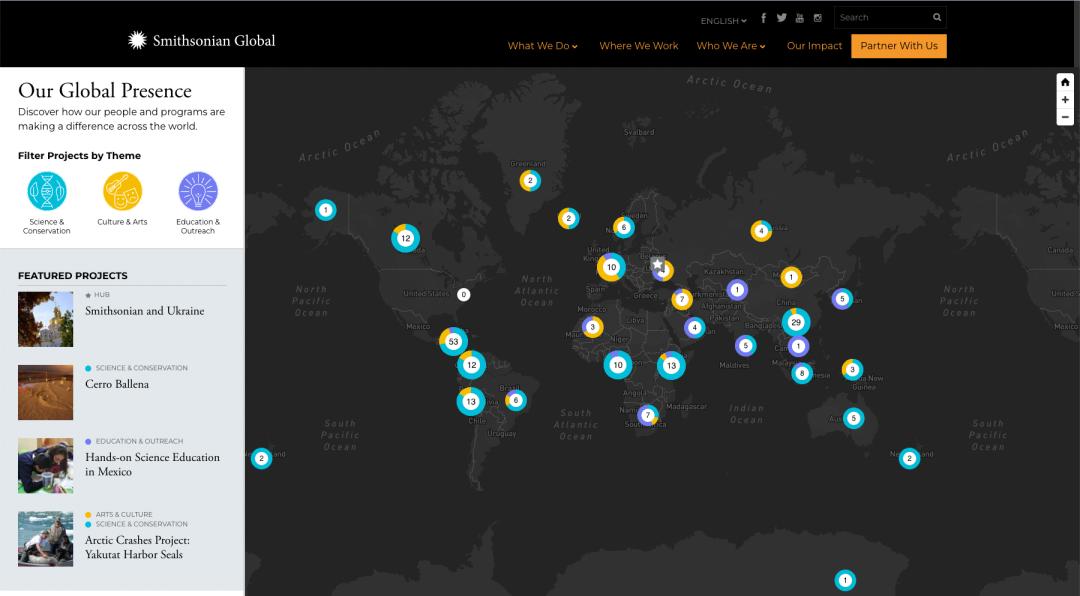
The right design and development can make a boring pile of numbers into a compelling story. Like manipulating pieces in a puzzle, your audience can filter the settings of an interactive data display to reveal new insights and build fresh understanding. We craft interactive assets to fit neatly into a web page, mobile application, or an enormous touchscreen– responsive to both the digital environment and audience needs.
Related case studies


we are mapping experts
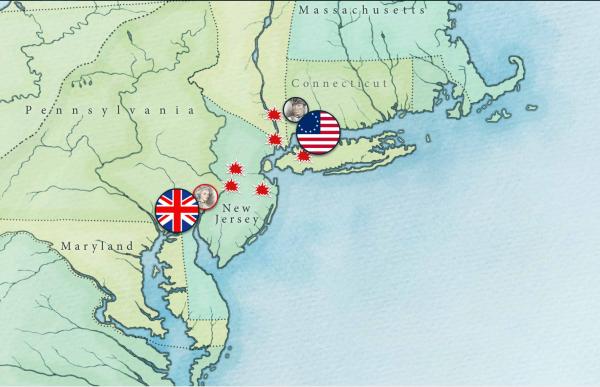
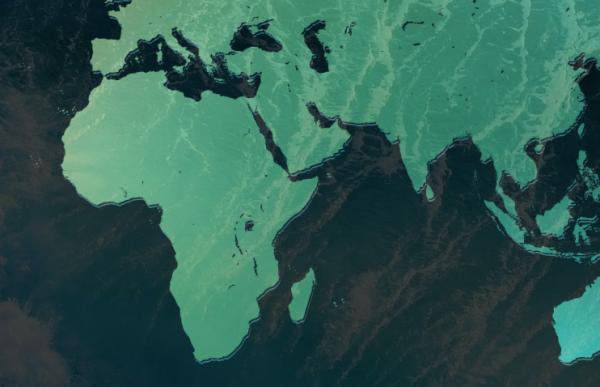
Do you have a story to tell that only a map can relay? Maps are one of our specialties and we use today’s latest GIS technology to connect your content to locations. Maps are only the beginning– from incorporating scrolly-telling or parallax scrolling to dynamic charts with motion graphics, we make data exciting to explore.