
Overview
Fetzer asked us to design and produce a comprehensive website to support the release of a multi-year research project titled, What Does Spirituality Mean to Us? A Study of Spirituality in the United States. The interactive website reflects on the content found in their 121-page final report and shares hundreds of responses from the study’s participants including drawings and comments that consider the nature of spirituality.
About this project
The qualitative research comprised 16 focus groups in five cities and 26 in-depth interviews with people from a range of spiritual and religious backgrounds. Insights from that research informed a nationally representative survey administered to more than 3,600 people in the U.S. in January-February 2020. An interactive component of the website looks more deeply at the study participants’ responses and shares their thoughts on a wide variety of questions. We worked with the project team at Fetzer and their communications partners at Hattaway Communications on a year-long process to imagine how to deliver an engaging, interactive website that could make the research results come to life for a wide audience.
The IK approach
Interactive Knowledge offered the project team a vision for an interactive approach to show how the research study’s participants’ responses were connected based on common themes. We built a prototype that demonstrated the interactivity and provided a compelling user experience. The Fetzer and Hattaway project team members agreed with the vision and the execution of our initial prototype so we completed the design and went into production. Visitors to the website are drawn to the highly visual interface and the interactive component of the website has been very popular.
![Drawing. A sun in the corner with snow tipped mountains and a road with trees below and a religious symbol. Quote reads: "When I think of spirituality, I think of being connected to the earth. [...] I feel like we're greatly connected to that on a very deep level." Jacqueline, 30. Very Spiritual/Moderately religious (Buddhist)](/sites/default/files/styles/teaser_square/public/2023-11/FSS_image%20grid%206.png?h=ebb127a5&itok=kwmhjwfZ)
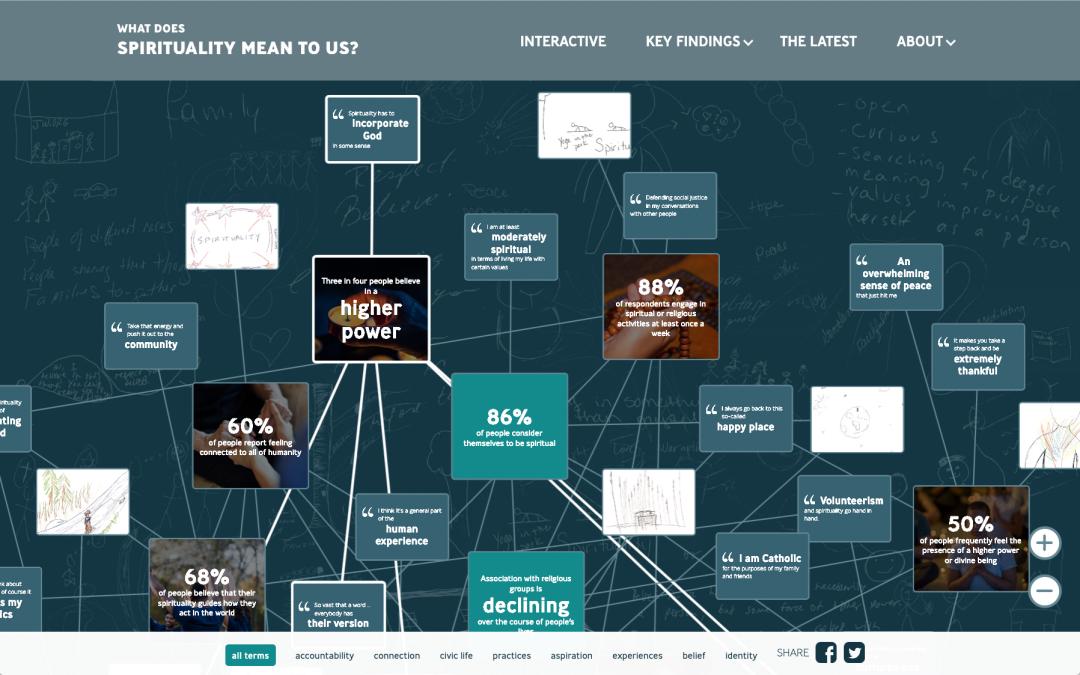
Dynamic Data Visualizations
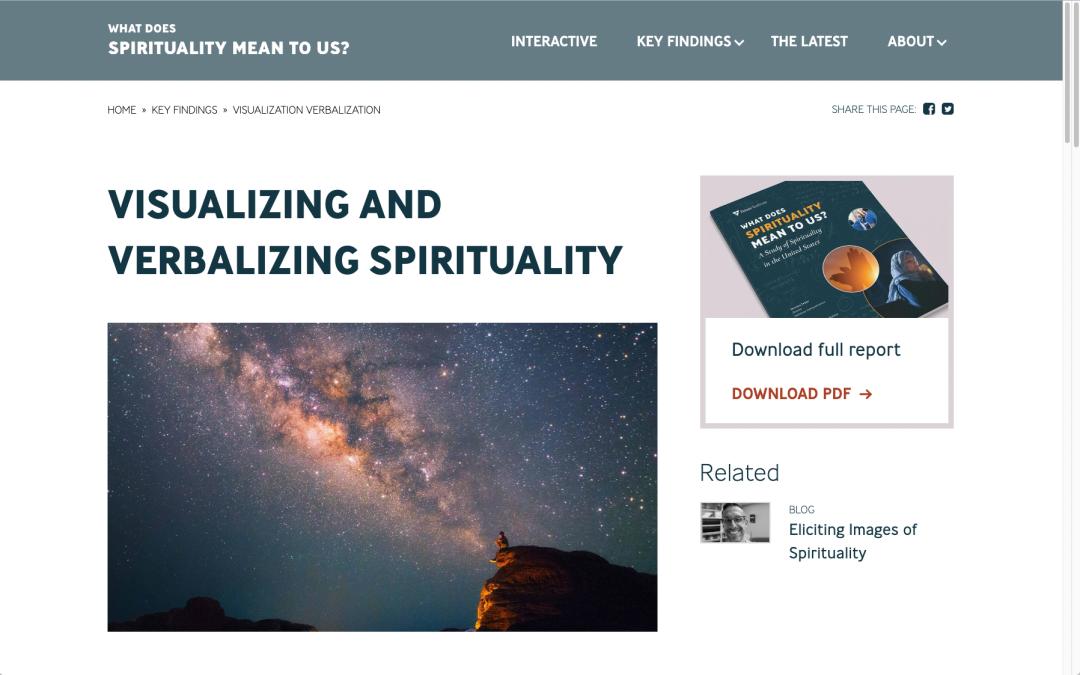
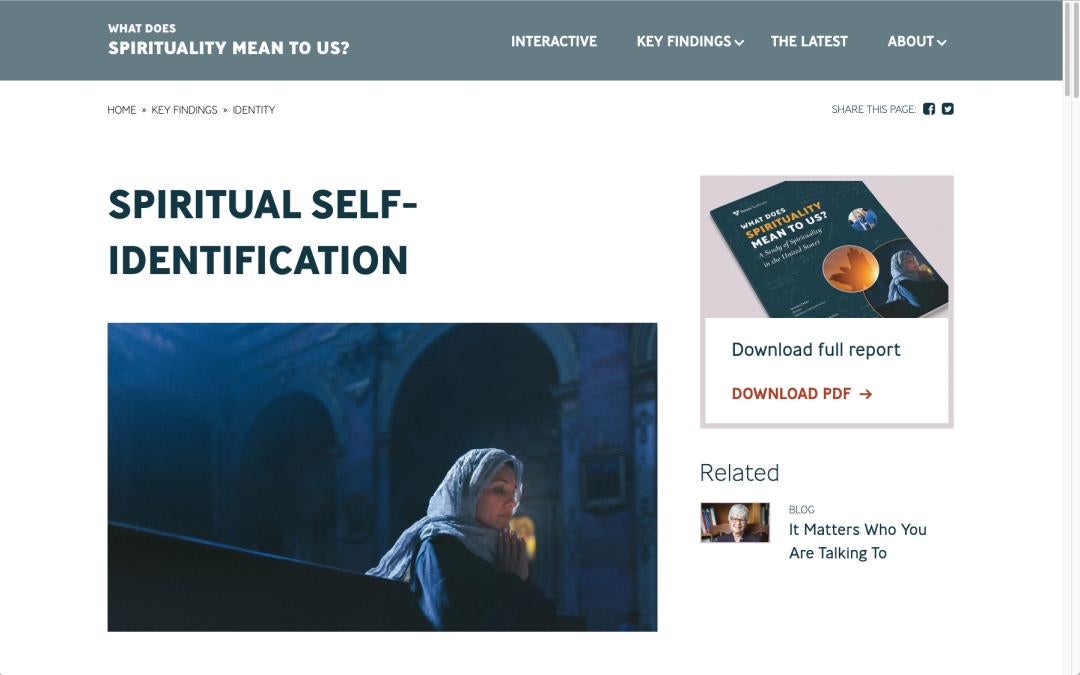
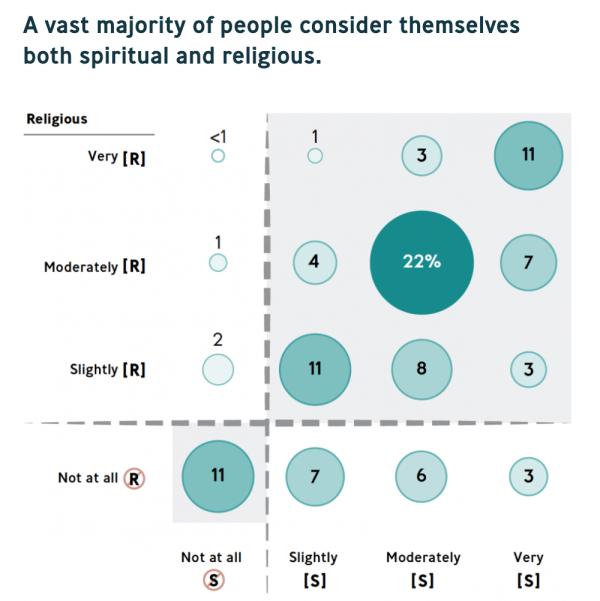
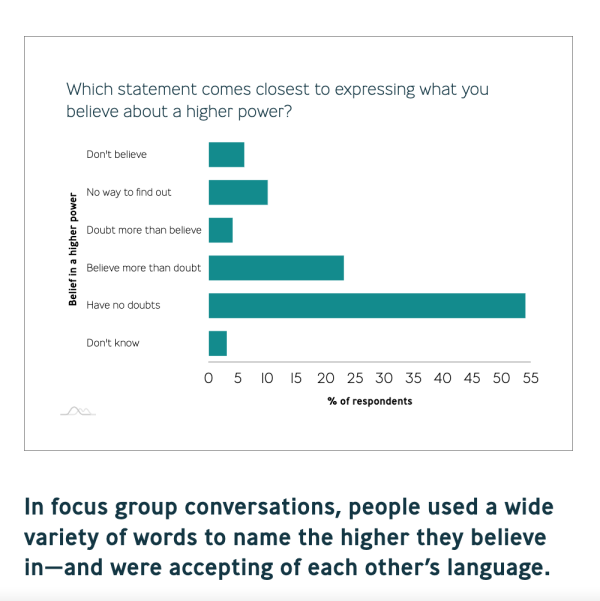
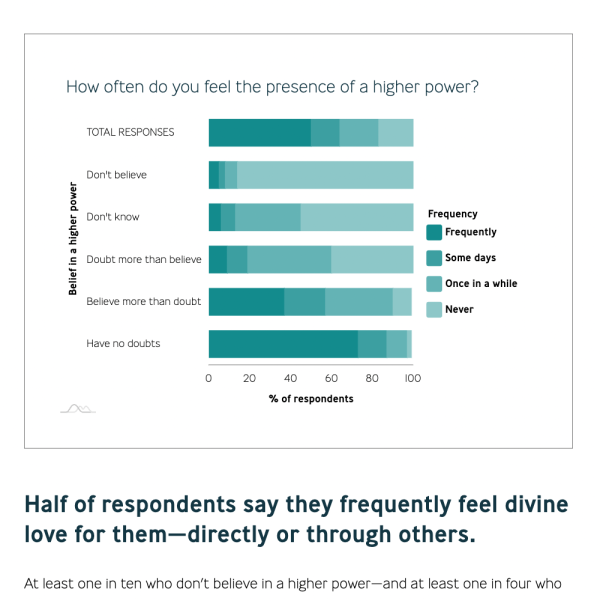
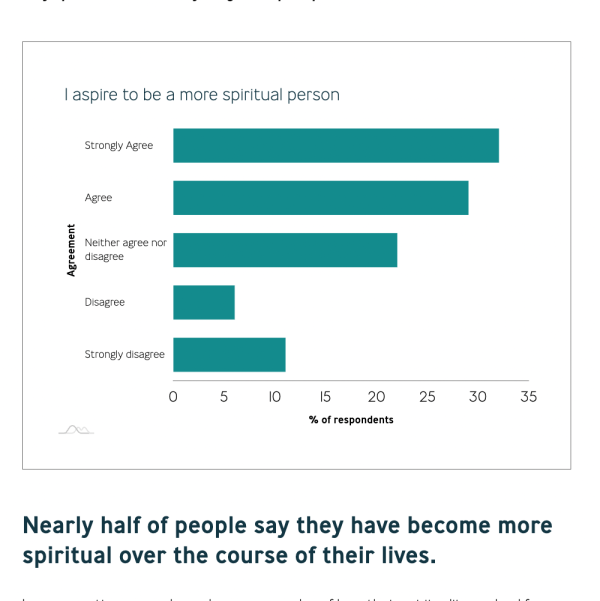
The website provides interesting data visualizations and creates a context for how this new insight can be applied to everyday life. The study results are organized using eight themes that emerged from the participant’s responses. A series of charts were created and curated for each of the eight themes. The charts show a summary of responses to questions based on how a participant reported his or her own level of spirituality or involvement with religion. These charts deliver some of the most critical results of the study in an easy to understand format.
Unique Interactive Experience
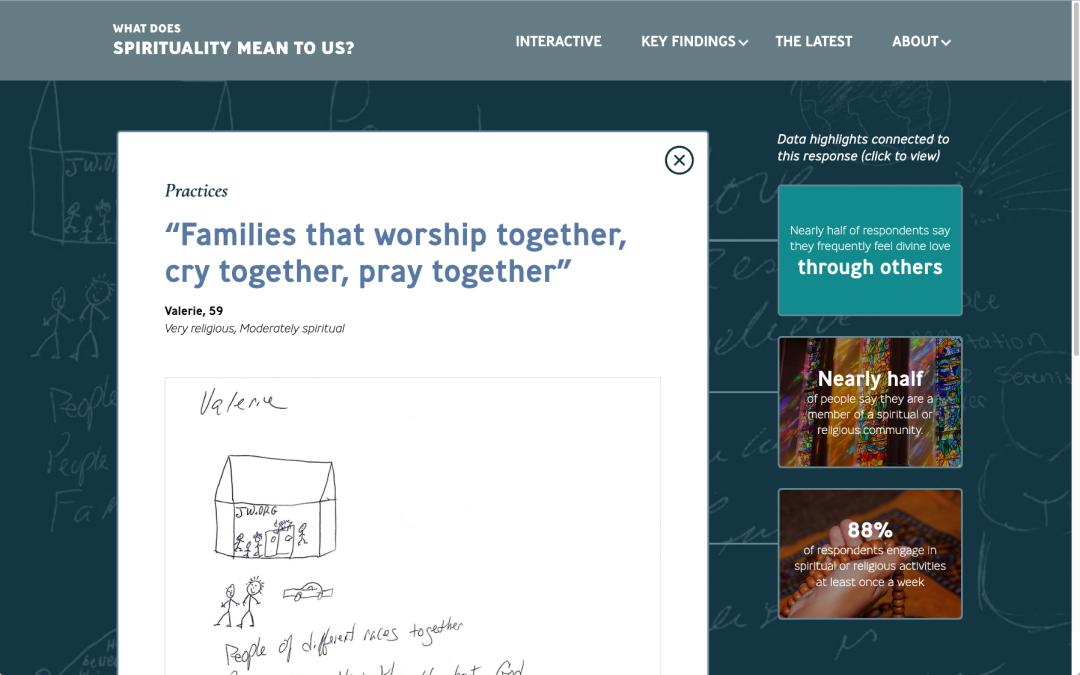
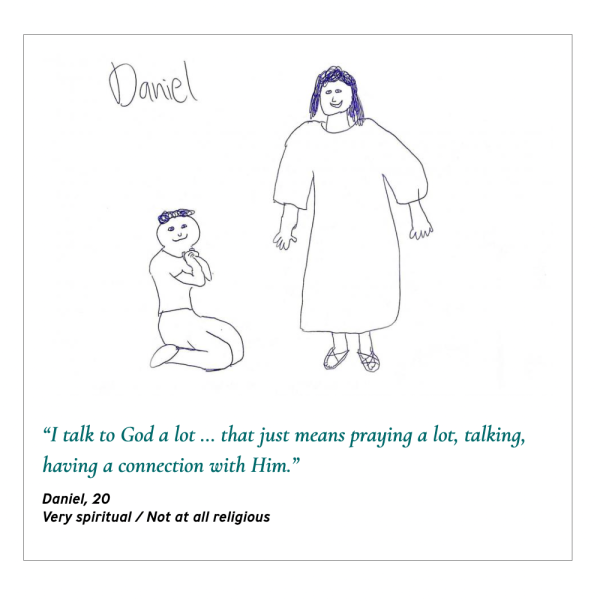
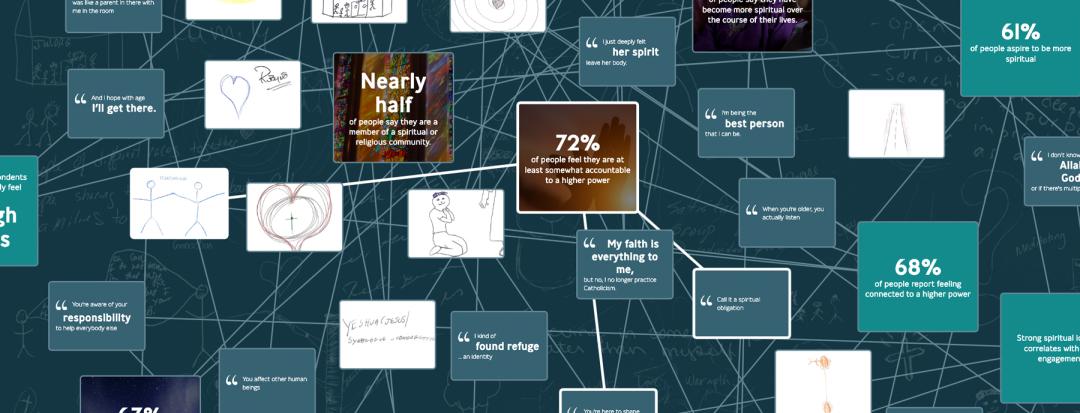
The interactive feature uses actual content from over 3,600 participants. Most participants were asked to respond to a variety of questions and some were asked to draw or sketch their responses to a few of the questions. The sketches form a rich archive of the approach these people have to their spirituality. The interactive experience begins with a presentation of excerpts from the written responses, highlights from the sketches, and key findings that help deliver a context for understanding the results. Each of these three types of content is displayed as separate but connected ‘nodes’ on the screen.
Visitors to the site can click on any node to see a detail page that displays three interesting things:
- The full text and a brief analysis of the participant’s comments along with their name, age, and their self-reported level of spirituality.
- The common theme that this response shares with other responses.
Additional data that helps contextualize the response when combined with other similar responses. - The content on the detail page provides a way to navigate and process the study’s results by clicking on one of the related nodes that are displayed in the sidebar or clicking on the theme to learn more about that Key Finding.
Each node is visually connected to many other nodes that are highlighted upon rollover so the connections are illustrated. In addition, the eight major themes that organize the responses are listed at the bottom of the screen. Choosing one of the themes will filter the nodes so that only the nodes related to that theme are displayed.
The Results
Fetzer called on a number of advisors to review their work as the study was planned, executed, compiled, analyzed, and reported. These advisors have commented on the results of the study and reflected how this research can be used to help address division in American society among other current issues. Their posts add insight and direction for further action and contemplation. The site is updated regularly with new blog posts and news as the study is shared around the country. A study coming in 2024 will compare the findings from 2019 to 2023’s post-COVID world.